The California Duck Curve Is Real, and Bigger Than Expected
Back in 2013, California’s grid operator CAISO released a report on how the growth of solar power was going to change the state’s energy balance over the coming years. In that report was a chart referred to as the “duck curve” for its distinctive shape — a deep midday drop in net load, driven by lots of solar flooding onto the grid, and a steep ramp-up starting in the late afternoon and extending into evening, as solar fades just in time for people to come home from work and start using a lot of electricity.
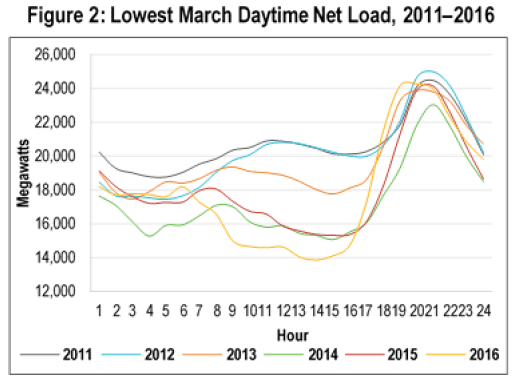
CAISO identified this typical cool, yet sunny March day as the power grid’s biggest challenge over the rest of the decade. Flash forward to 2016, and it turns out that the changes in load-supply balance are coming even faster and deeper than expected — and not just in the springtime.
An analysis of CAISO data from 2011 through mid-2016 by consultancy ScottMadden reveals that California has largely exceeded its 2013 projections for lower net loads and higher ramps in energy demand. These changes are occurring in the wintertime too, another season that’s light on air conditioning load. In addition, the deepest drops are happening on weekends, not weekdays.
In its initial projection, CAISO predicted that its minimum daytime loads — the deepest part of the belly of the duck curve — would hit 15,000 megawatts by 2016, down from about 20,000 megawatts in 2011.
ScottMadden used real-world data from every March over the past six years, and found that minimum daytime net load dropped 31 percent, from 20,118 megawatts to 13,854 megawatts, over that time.
In terms of timing, the real-world data is about two years ahead of schedule — in 2015, the lowest daytime net load was 14,335 megawatts, roughly equal to CAISO’s projection for 2017, the report found. “Further, oversupply risks attributable to variable generation resources have grown more rapidly than the duck curve chart,” it noted.
The effect wasn’t limited to the lowest-load days, either. “There were numerous days in 2015 where the actual minimum net load was below the duck chart forecast,” the report noted, including a total of three weeks from February to May, as well as several days in November and December.
Ramp rates — the neck portion of the duck curve — are also more severe than CAISO originally projected, according to ScottMadden’s analysis of the steepest 3-hour ramp periods between 2 p.m. and 9 p.m. over the past six years. In 2015, the steepest ramp hit 10,091 megawatts, up 62 percent from 2011. Big ramps are also happening more frequently. In 2015, the 3-hour ramp exceeded 5,000 megawatts over 58 percent of the year, up from only 6 percent of the year in 2011.
Looking beyond the month of March also allowed ScottMadden to examine real-world duck curve manifestations in different seasons. The results indicate that winter, not spring, is the season with the biggest ramps, with the 20 steepest late-day 3-hour ramps in 2015 occurring in December, November and January.