Duck Hunting at the California Independent System Operator
California’s excess of solar power challenges the statewide independent system operator’s ability to balance its system without curtailing low-carbon supplies and ramping up natural gas generation. It’s called the “duck curve.” Is the region’s growing energy imbalance market the solution, or will it take a full-fledged independent transmission organization to slay California’s electricity duck?
The California Independent System Operator (CAISO), manager of the Golden State’s wholesale electricity market, in its 2015 strategic plan identifies “overgeneration” as a major challenge. The ISO has a lot of renewable generation—particularly solar—that does not match when customers need power. The problem is reflected in the well-known “duck curve” (Figure 1), first published in 2013.
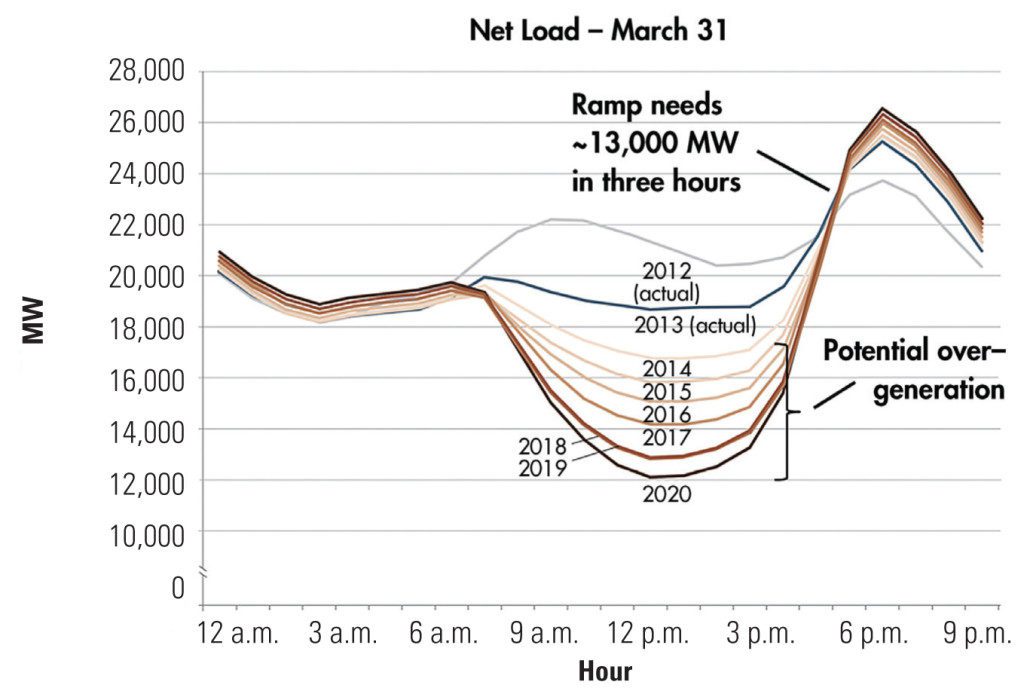
The duck curve is a graphic representation of a mismatch between the time when a large supply of solar power comes onto the California grid and when the system demands power. The duck curve shows a major drop in electric load in midday when solar hits its peak, swamping the grid at a period of low demand and potentially pushing net load below the point where older baseload plants can ramp down to compensate. In the late afternoon and evening, when solar begins to fade, people are arriving home and boosting electricity use, ramping up demand. With the sun going down, quick-ramping gas has to come online in a hurry.
In its 2015 plan, CAISO said that overgeneration “arises when there is more electricity than there is demand to use it…. Current studies show that this risk will grow quickly after 2020 with higher levels of renewable generation in the mix—even after fossil fuel power plants have reduced output as much as possible. When that occurs, some renewable generation may need to be curtailed, which would be a missed opportunity to use clean power at a minimal marginal cost.”
“The downside” of the duck, CAISO CEO Stephen Berberich told POWER recently, “is turning off power that is clean, with low marginal cost, and that people have paid for.” The solar generation gets dumped mid-day because the state’s older fossil plants can’t cycle fast enough to deal with the late afternoon shift. Come sundown, the demand neck of the duck ascends as solar trails off. “That requires ramping” of the power system’s fossil generation to meet demand, Berberich said. California has built some high-tech, fast-responding gas plants recently, but that runs counter to the state’s goal of reaching 50% renewables by 2030. “We are relying on gas plants here in California” to meet the afternoon and evening demand. “Our goal is to decarbonize the grid, and we don’t want to have to rely on gas.”
So far, however, it is. California is dependent on gas for about 56% (some 42,000 MW) of the state’s 75,000 MW of electric generation, compared to 5,800 MW each for solar and wind (and 10,000 MW of hydro), according to Energy Information Administration (EIA) data. Those figures include all of the state’s generation, from investor-owned utilities, non-utility generators, and public power systems.
■ The duck curve is most severe on weekends “because of their lower system loads” despite consistent solar generation. “Conversely, higher system loads on weekdays mitigate the midday decline in net load and the impact of the duck curve.”
■ The duck curve doesn’t occur just in sunny spring months, as earlier analyses had assumed. CAISO’s 2013 analysis that first identified the duck curve was based on data for March 31. The ScottMadden analysis found the steepest ramps in 2015 came in December, November, and January, not March.
■ Utility solar, not rooftop panels, feeds the duck. “If the belly of the duck is formed by less visible distributed resources,” says the report, “one would see it manifested in both the system load and the net load. This is not the case in the California duck curve. Instead, we see a smooth system load and a concave net load, which is indicative of the influence of utility-scale solar rather than distributed generation.”
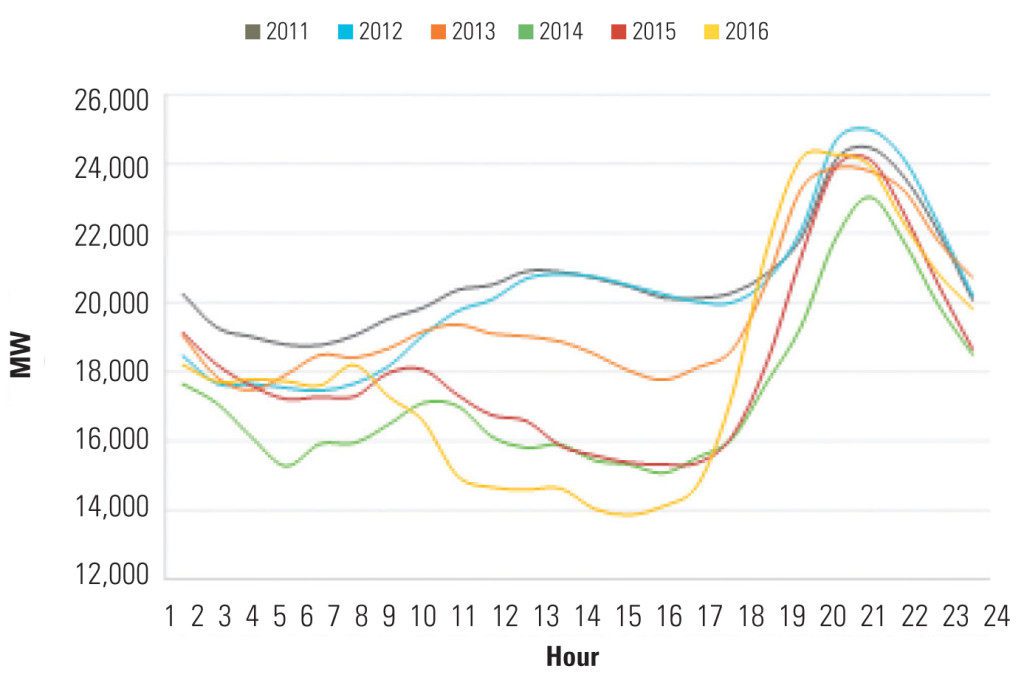
ElectricityPolicy.com commented that, “it appears the famous fowl known as the California ‘duck curve’ is developing a deeper belly, with steeper ramping that will require more flexible and fast-responding resources.”