GE And Tesla Motors, Cynically Promoting Renewable Snake-Oil
CAISO’s Renewables Watch web-page is a veritable treasure trove of data for researchers who are willing to download, organize and analyze daily reports. For every day since April 20, 2010, the web-page includes links to a daily graphic summary and hourly tabular data for six classes of renewable and four classes of conventional generating assets. Since my inner bean counter loves data, I downloaded a full year of hourly CAISO power production data for wind, PV solar and thermal solar, together with four months of data on total power production.
The first graphs I created from the CAISO data are simple variants of the well-known “Duck Curve.” The big blue blocks at the bottom of each graph represent all conventional power sources and a few reliable renewables like geothermal, small hydro, biomass and biogas. The yellow blobs in the middle represent PV solar power and the green stripes on top represent wind power. Separate graphs are presented for all four seasons.
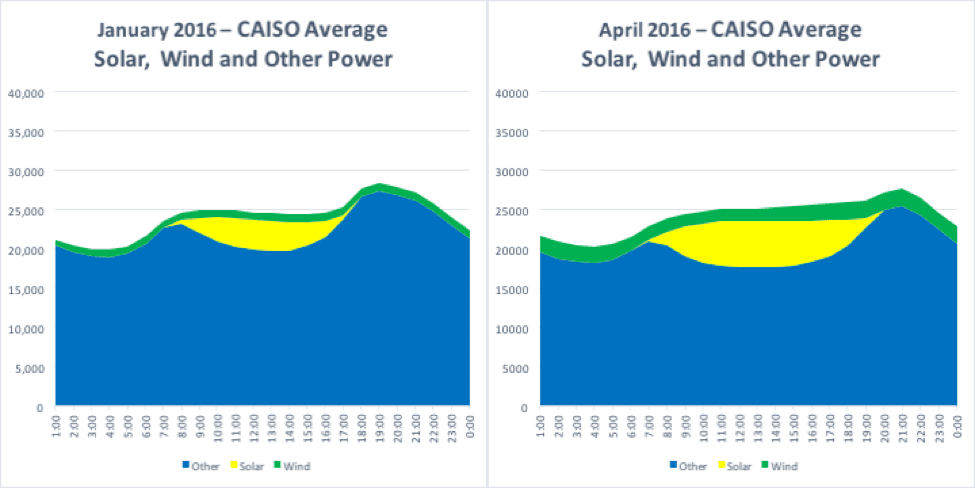
When you average the power production values over the course of a month, the lines get smooth and sleek and wind and solar almost look desirable. They may not do much to reduce daily demand peaks that arrive around sunset, but they do appear useful during the mid-day ramp.
A very different picture emerges if you don’t use averages to smooth the data. My second set of graphs present CAISO’s daily wind power production data for Q4-15 through Q3-16 and show the data points for each day as discrete lines.
For each of the 12 months, I picked the highest power production day during the month and then assigned a failing “F grade” to any day when total power production was less than 60% of the highest day. It may seem like an unscientific throwback to grammar school and grading on a curve, but it highlights the tremendous variability of wind power with a series of monthly graphs that frequently bear a striking resemblance to bowls of linguine.
As you contemplate the monthly wind power graphs I’d like you to remember four critical points:
At the utility level, aggregate customer demand for electric power ramps smoothly up and down over the course of an ordinary day like you saw in the modified duck curve graphs;
If a wind power asset is delivering highly variable power to the grid, a utility must have a corresponding conventional power plant working in tandem to make the combined power output of the wind and conventional facilities smooth and reliable;
Power plants, like most machines, are highly efficient when you run them at a steady state, but when operators are forced to ramp plants up and down to compensate for the variability of wind power, it’s like taking a car off the open road and dumping it into city traffic. Efficiency plummets while wear and tear on the machinery soars; and
The graphs represent system-wide wind power totals scaled to 5,000 MW for an ISO that serves three-quarters of the State of California, or 30 million customers spread over 124,000 square miles.